COMP0035 Tutorials 3 and 4: Using pandas for data preparation and understanding
The following are expected to take two tutorial sessions to complete. An expected split is shown below.
- Getting started
- Tutorial 3:
- Tutorial 4:
- Further information
Getting started
Introduction
In this tutorial and tutorial 4 you will use pandas to explore a dataset by understanding what it contains. You will try to identify any problems with the data that need to be addressed ('cleaned'); and consider whether the data is sufficient for your project.
Problems with the data can include missing values, incorrect data, data in the wrong format or duplicates. The presence of such issues can result in inaccuracy in any resulting data analysis or machine learning models.
Create a repository from a GitHub template repository
For this week and next you will need to have a Python project with pandas, matplotlib and openpyxl installed in the virtual environment.
-
Login to GitHub.
-
Go to the following repository on GitHub: https://github.com/nicholsons/comp0035_tutorial3
-
Create a copy into your own GitHub account by selecting the green 'Use this template' button.
-
Clone the repository in your IDE (see tutorial 1 or the following documentation).
-
Create and activate a virtual environment for the project in your IDE (see tutorial 2).
- Unix/macOS:
python3 -m venv .venv source .venv/bin/activate- Windows:
py -m venv .venv .\.venv\Scripts\activate -
Install pandas, matplotlib and openpyxl, which are listed in
requirements.txt, in the virtual environment ( see tutorial 2).pip install -r requirements.txt
How to reference files in Python
The problem with file paths
In this week's activities, and in your coursework, you will use a dataset that is one or more files that are stored in your project's directory structure. You will need to be able to reference the location of these files in your Python code.
You should not hard-code the file paths that are specific to your computer when writing code that others will use.
For the coursework, the marker will not have the same directory structure on their computer as you.
The main issues that arise if you hard-code a specific file path are:
-
Windows and Unix/Mac file paths are different.
Consider a Mac/Unix style file path
/Users/jojo/py_project/test.pyand a Windows file pathC:\\Documents\py_project\test.py. The syntax and structure are different. Further where you have the files for a project on your computer is likely different to where someone else does, so using shared code where file paths are written using a particular operating system format using a given person's directory structure quickly becomes problematic. -
The root folder can differ depending on your code editor.
If you are writing code in VSCode and PyCharm then filepath roots are typically the project root, that is you can add paths that are relative to your project root and ignore the preceding local file system directory structure. As an example a file in the data folder would be
data/file.csvand notC:\\Documents\py_project\data\file.csvDifferent environments and editors may set the project root differently. -
The relative path can differ depending on where the code is called from.
If you use a file path in a code file so that it is relative to the current file, you are likely to get issues if you then import that file and execute it from another. For example: You have the following directories and files:
/data/datafile.csv,/module_a/code_a.pyand/module_a/module_b/code_b.py. Incode_a.pyif you reference the datafile using../data/datafile.csvin a function that you then import and use insidecode_b.pyyou might get an issue as relative tocode_b.pythe data file is not in../data/datafile.csvbut in../../data/datafile.csv. It's a little more complex than this, however, using relative file paths can lead to problems.When you are working with packages in Python then relative paths are relative to the current working directory rather than the code file it is written in.
-
Referencing files in web apps introduces further complexity.
In web apps you will also need to consider that where files are located on a development platform for example is likely different to that of the deployed version. This isn't covered in COMP0035 but will be considered in COMP0034.
Use Python Pathlib
Some solutions suggest the use of os.path however from Python 3.4 the pathlib module was introduced and will be used
in the teaching materials. Using Pathlib addresses many of the above-mentioned issues:
- Avoids the
\\versus/issue by using the Pathlibjoinpathmethod. - Has methods that let you determine the current working directory e.g.
pathlib.Path.cwd(). For example:my_file_path = pathlib.Path.cwd().joinpath('data','datafile.csv')instead ofdata/datafile.csvordata\datafile.csv - Allows you to code relative to the current code file, whatever that file is
e.g.
pathlib.Path(__file__).resolve().parentwould go to the directory that is the parent of the current file.
Datasets
The data in the activities is from the following sources.
The data is in the paralympics_raw.csv from the repository. The data has been modified such that it can be used for a
data cleaning activity.
Questions to be answered (paralympics data set)
To guide the data preparation activity, assume that the questions to answer from the data set are:
- How has the number of male and female competitors in the paralympics changed over time?
- Does the ratio of male:female competitors vary between winter and summer olympics?
In addition to the charts that will attempt to answer the questions, the web app will also feature a searchable history of paralympic events with information about each event. The event information will include the country flag, the paralympic logo, start and end dates and the duration of the event.
To answer the questions requires the following data fields:
- Year
- Summer / Winter
- Number male competitors
- Number female competitors
To generate the event pages requires additional data:
- Event start and end dates
- Event duration
- An image file of the flag of the country hosting the event. The image files are named using the convention is ' NOCcode.png'. The NOC code is a 3-letter code from the National Olympic Committee that signifies a given country.
Tutorial 3
Attempt to solve the following code problems. For each you are given starter code which is in the src/starter_code
directory.
An implemented solution for each is given in the subsequent problem. Other solutions will be possible!
Try not to look ahead to the solutions. The aim of this is not to get everything right first time but to learn how to use pandas. Often making mistakes is more informative!
If you are using GitHib Co-pilot then it is likely to offer you solutions as you type. These may differ to the examples given.
The problem code is structured into functions. Some functions may seem trivial or unnecessary. Functions with docstrings are used to try and get you into the habit of coding in potentially reusable functions rather than procedural code.
Problem 1 Create a Pandas dataframe and load the dataset into it
Open src/starter_code_problem1.py.
Look at the lines after if __name__ == '__main__':. The first uses the Pathlib library to read the csv file from a
location that is relative to problem1.py. It can be located by going to the parent of problem1.py which
is starter_code, then to its parent (src) and then go the data directory and then the paralym[pics_raw.csv. This
is not the only file location strategy you can use however it should work in most circumstances in this course.
The code then calls the function create_dataframe() and passes the csv file as a parameter, or argument.
You now need to complete the create_dataframe() function using the # Comments as a guide.
You will use pandas.read_csv. This method infers the column names from the first row by default. If the file was a .xlsx file you would instead use pandas.read_excel.
There are lots of options you can apply on reading a file into a pandas dataframe such as selecting certain columns to import, setting data types for columns, etc. Please use the above references as you are likely to need some of these options for your coursework.
Problem 2 Print information about the DataFrame
There are Pandas dataframe functions that give you information about the data in the dataframe. You should use these in your coursework to demonstrate you have explored and understood the data.
This activity asks you to use some of these functions:
- pd.DataFrame.shape()
- pd.DataFrame.head()
- pd.DataFrame.tail()
- pd.DataFrame.info()
- pd.DataFrame.describe()
- pd.DataFrame.columns
- pd.DataFrame.dtypes
Use the links above to see what the functions do and how to use them.
Edit problem2.py and use pandas DataFrame functions to:
- Print the number of rows and columns in the DataFrame using
.shape - Print the first 7 rows of data using
.head()and the last 6 rows using.tail() - Print the column labels using
.info()or.columns. Are there any columns that you don't think will be needed to answer the questions?. - Print the column data types using
.info()or.dtypes - Print general statistics using
.describe(). Why are some columns not shown in the output?
Note: As well as describe() there are many methods
for individual statistics.
Problem 3 Delete unnecessary columns
Given the summary in the introduction; you don't need the columns for Events, Sports and Countries.
One approach could be to read only the columns you need when you create the DataFrame. You know the column names now as from problem 2.
import pandas as pd
from pathlib import Path

if __name__ == '__main__':
    cols = ['Host city', 'Year', 'Country', 'Type', 'Start', 'End', 'Participants (M)', 'Participants (F)',
            'Participants']
    raw_data_csv = Path(__file__).parent.parent.joinpath('data', 'paralympics_raw.csv')
    df_selected_cols = pd.read_csv(raw_data_csv, usecols=cols)
    print(df_selected_cols)
As you already have the columns then instead you will delete them.
Use the pandas.DataFrame.drop() to remove either rows or columns.
Most methods in pandas return a new object and leave the original untouched.
To alter the DataFrame in-place you can sometimes use the attribute inplace=True; though most examples will instead
allocate the result of an action to a new dataframe object; e.g.
df_with_less_columns = df_original.drop(['MyCol2', 'MyCol4'], axis=1)
Also note the axis number. Rows in a DataFrame are axis=0 and columns are axis=1.
Open problem3.py and edit the prepare_data function to drop the list of named
columns ['Events', 'Sports', 'Countries'] and assign the resut to a new variable (DataFrame object)
called df_prepared.
Problem 4 Identify and address any missing values
Missing values or missing data are those values that are not present in the data set.
There are many reasons for values to be missing, for example because they don't exist, or because of improper data collection or improper data entry.
Missing values in data can reduce the accuracy of any resulting data analysis or machine learning model.
In pandas, missing values are represented by None or NaN (Not a Number). Note that empty strings ('') are
not considered NA values.
In data science, missing values are typically categorised as:
- Missing Completely At Random (MCAR). There is no relationship between the missing data and any other vales in the dataset. There is no pattern for the missing values. The advantage of such data is that the statistical analysis remains unbiased.
- Missing At Random (MAR). The missing values are related to variables that are complete, i.e. there is a relationshp between the missing data and other values. The missing data may be estimated using the related values.
- Missing Not At Random (MNAR). There appears to be a pattern to the missing data; however this pattern does not depend on other variables that are in the dataset but some unknown variable. This can bias the results of any analysis.
This article summarises these succinctly, though there are many references you could look up if you wish to understand the topic further.
There are different ways to deal with missing values:
- Do nothing (this may be appropriate in some circumstances).
- If your data set is large enough and/or the percentage of missing values is high, you may choose to delete the rows and columns that contain the missing data;
- Use an imputation technique to fill the missing values (e.g. mean, median, most frequent etc.)
The decision will depend on the type of data, the actions you want to perform on the data, and the reasons for the missing values.
This article on Towards Data Science gives pros and cons of some common imputation techniques. You are not expected to understand the specific imputation techniques and make an informed choice to apply to your coursework. For this course it is sufficient that you understand the implications of missing data and that you state your decision i.e. whether to do nothing, remove data or use imputation.
In this problem you will use pandas to find where there are missing values. Having identified them, you will then take course of action to address them.
Open 'problem4.py' and complete the code for the following steps:
- In
main, show the number of missing values in the DataFrame usingisna()orisnull(). 'True' indicates a missing value. - Step 1 shows all the data which may not be practical in a large dataset. In
main, create and print a dataframe with only the rows that contain any missing values. Example of the syntax to create a DataFrame with missing rows:missing_rows = df[df.isna().any(axis=1)]. - In
prepare_datawrite code to address the missing values. Decide what to do with the missing data (delete the row/column; replace nulls with a computed or other value; do nothing). For this activity:- Drop the row that doesn't have info on the male and female participants as it would be incorrect to guess or
compute this. Drop the row with missing Participants (M) and Participants (F) using
dropna(). - The missing 'Type' data could be inferred from the dates since the years correspond to 'Winter' events. For the '
Type' column, fill the NaNs with 'Winter' using
fillna()
- Drop the row that doesn't have info on the male and female participants as it would be incorrect to guess or
compute this. Drop the row with missing Participants (M) and Participants (F) using
You will need to refer to the pandas documentation:
Problem 5 Dealing with inconsistent values in categorical data
Categorical variables are those where the data can be divided into categories, or groups. For example: race, gender, age group, and educational level.
Categorical variables can be problematic for data analysis.
One issue is that many machine learning algorithms cannot handle categorical data. To overcome this, categorical values can be replaced with encoded data. For example: Hot = 1, Warm = 2, Cold = 3. Techniques for addressing this is not covered in this course, however there are Python packages (or functions within packages) that will handle this process of encoding; a popular option is OneHotEncoder .
A second issue is that depending on how the data was collected, categorical data may be entered inconsistently, e.g. in an address where the values "UK", "Great Britiain", and "United Kingdon" all appear and relate to the same country. However, as they are spelt differently any functions to count, group etc. would not recognise the similarity.
This issue occurs in the paralympics data in the Type column. To address this, add code to problem5.py to:
- In
main, print unique values for the 'Type' column. A single column is a Series so you can usedf['ColName'].unique(). - In
prepare_data, remove the whitespace using '.str.strip()' function .
A solution is given in problem5_solution.py and rather than problem6.py as the code structure is changed for
problem6.
Tutorial 4
Problem 6 Combining data
The flag images are referenced by the NOC region code. Let's assume that we need to add the NOC region code to each row in the DataFrame.
The NOC region codes are in a csv file: /data/noc_regions.csv.
Both sets of data have a column with the country name, so you could merge the records based on that common column. The noc data has more rows than the current dataframe, so you won't want to merge all rows from noc, only those that match rows in the paralympic events DataFrame.
To do this using pandas:
- To combine two dataframes with a common index you can use pandas.DataFrame.join():
- To combine two dataframes where the common column is not an index then you use pandas.DataFrame.merge() .
In this case the 'country name' is not an index so use merge(). The general syntax for this is:
DataFrame.merge(right, how='inner', on=None, left_on=None, right_on=None, left_index=False, right_index=False,
                sort=False, suffixes=('_x', '_y'), copy=True, indicator=False, validate=None)
To merge data you need to have a basic understanding of join types which is specified by the how= argument.
how='left'Returns all records from the left DataFrame, and the matched records from the right DataFramehow='right'Returns all records from the right DataFrame, and the matched records from the left DataFramehow='outer'Returns all records when there is a match in either left or right DataFrame. (Union)how='inner'Returns records that have matching values in both DataFrames. (Intersection)
Open problem6.py and add code to solve the problem. The prepare_data function has been changed to accept two
DataFrames:
- In
main: Create a new dataframe with noc codes, this will be the 'right' DataFrame. You only want the 'NOC' and ' region' columns. - In
prepare_data: Create a new DataFrame usingmergethat returns all records from the left (the paralympics event data) and the matched records from the right (noc codes). Merge on the 'Country' field in the event data, and the 'region' field in the NOC code data. - In
prepare_data: drop either 'Country' or 'region' from the prepared dataset as they contain the same data. - In
main: create a dataframe containing the merged data usingprepare_data(df, df2)where df=events_df and df2=noc_df. - In
main: check the merged dataframe for NaNs. Unless the country names match exactly then the NOC code will not be matched. - In
main: Print all rows of the noc DataFrame to try and find Korea and GB. Pandas is currently set to display number of rows based on the size of the event data. To see all the rows try adding to main:with pd.option_context('display.max_rows', None, ): print(noc_df)- You should see that "Great Britain" is listed as "UK", and "Republic of Korea" as "Korea"
- In
prepare_data: Replace the NaN for 'Great Britain' with 'GBR', and for "Republic of Korea" use 'KOR'. You need to replace a value in one column based on a condition in another. There will be other ways to do this, I use mask .
One solution is given in problem6_solution.py.
Problem 7: Compute new data
The start and end date columns are text format and the date doesn't include the year. Year is a separate field.
To create a single date column in a format you can work with for charts:
- combine the dd-mmm and the yyyy to create a date for the start and end columns
- add a new column called duration with values calculated as the difference in days between the start and end dates
One way to do this is as follows, you may work out a more efficient way to do this!
- In
main: Print the data types of the['Year', 'Start', 'End']columns - In
main: Check the format of the values in['Year', 'Start', 'End']by printing a couple of rows - In
prepard_data: Add the year to the Start and End columns to create a date in String format. Year is int and Start/End are strings so to combine as strings you need to first convert the Year to string. The code to do this for Start is given to you. Add code for the End column. - In
prepare_data: Change the column datatype for Start and End from string to date-time format. 'Start' is given to you. Add code for 'End'. Usepandas.to_datetime. Pandas to_datetime handles most date formats so it should work without using theformat=argument. - Add a 'Duration' column to the DataFrame that is the difference in days between the start and end date. You can do
calculations on dates, the result will be a timedelta format which may not be suitable for the dashboard charts.
Convert the timedelta format to a type
intusing df['ColName'].dt.days
Problem 8: Save the prepared dataset
We have now carried out the data cleaning and preparation steps needed for this project so we will save the prepared data back to a .csv file.
You could also save the data to a database or other format.
Open problem8.py.
-
Add code add the end of the
prepare_datato save the output to file. You can also remove the return dataframe from the end of the function if you wish. Use the pandas 'to_csv()'.Note that the dataframe has an index column with row numbers that you don't need in the csv file. Use the argument
index=Falsewhen you useto.csv() -
Run the code and check that the file is saved to 'src/data/paralympics_prepared.csv'
Exploring and understanding the data
The next few problems focus on exploring and understanding the data. This aim is not to create polished result for a target audience. Your aim is to get a better understanding of the data to decide if what you have is largely free from data quality issues and that it suits the needs of your project. Through the exploration you may find further data cleaning activities that need to be carried out; or additional data that needs to be collected.
The print_df_information(df) function can be run again to provide some information about the prepared data set.
Problem 9: Identifying outliers
Identifying outliers is subjective and techniques include:
- Plot the data (e.g., histogram, scatter plot, boxplot)
- Use common sense
- Use statistical tests
Since this course doesn't expect any knowledge of, nor teach, statistics then we will check for outliers by creating a chart. A chart may also be referred to as a 'plot'.
In this problem let’s create a boxplot.
pandas dataframe have methods for creating and displaying plots. The functionality uses the matplotlib library to display the plots; though other charting libraries can be used.
Box plots have box from lower quartile to the upper quartile, with the median marked. 25% of the population is below first quartile, 75% of the population is below third quartile.
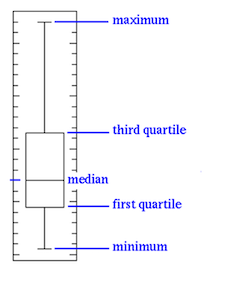
Source: statinfer
Boxplots can help us to get an idea of the data distribution which in turn helps us to identify the outliers more easily.
If the box is pushed to one side, and some values are far away from the box, then it is an indication of outliers.
The following code shows a basic example of creating a boxplot with pandas and rendering the chart using matplotlib. Numpy is only used in this example to generate the random numbers.
import pandas as pd
import numpy as np
import matplotlib.pyplot as plt

df = pd.DataFrame(np.random.rand(10, 5), columns=["A", "B", "C", "D", "E"])
bp = df.plot.box()
plt.show()
You may need to refer to:
- Add code to
problem9.pyto generate a box plot for the paralympics data.
If you managed that, then you will have noticed that it plots all the variables on the same scale. Since the numbers are
significantly smaller for duration than the numbers for participants, the result is that we can't see the duration
boxplot clearly. To see each variable in its own subplot try adding the argument subplots=True in the box()
method.
If you want to save the generated plot to an image file (you might wish to for the coursework, though not essential) try:
df.plot.box().get_figure().savefig('bp_example.png')
You should see an outlier in the duration. On examining the data you would find that this is because that year the Paralympics were in two locations, New York and Stoke Mandeville, and held on two different dates so the start and end span both events.
You could choose to:
- ignore the data
- try to find the data to allow you to split this into two entries
- remove the data
- compute the data
For now we will leave the data in and will need to remember the concern when we start to create charts.
Note: this data did not lend itself to histograms, however for your datatset a histogram may be more useful than a boxplot to understand the distribution of data and look for any outliers.
Problem 10 Line chart for timeseries data
In problem 9 we considered the use of boxplots and histograms to see the distribution of the data.
This example uses a line chart for timeseries data.
In a time-series plot, the x-axis represents the time, and the y-axis represents the variable being measured.
The next charts consider the number of participants by date over time.
Open problem10.py
-
Create and show a plot where
x="Start"andy="Participants".The distribution looks like this:
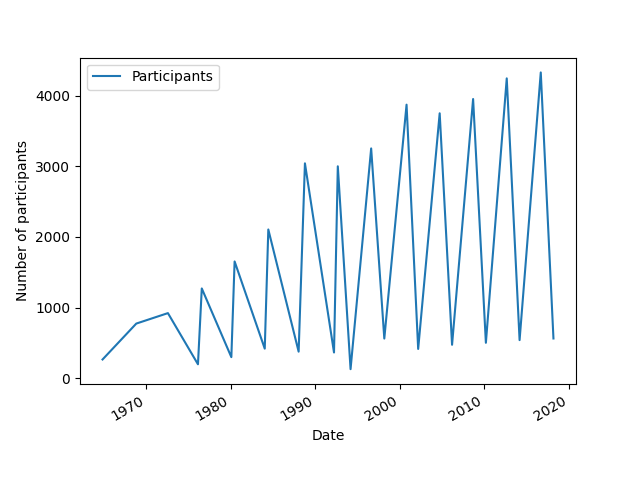
Winter events have far fewer participants than summer so it may be easier to split the two and consider them separately.
You may wish to comment out the code to show the charts before you start the next step, otherwise the code stops executing once the chart is displayed.
-
Modify the chart code above to group the data by the
Typecolumn before creating the plot. The general syntax is:df.groupby("ColNameToGroupBy").plot(x="SomeCol", y="AnotherCol").
If you wish to challenge yourself, display the charts showing the split of male and female participants.
You should be able to see from the charts that there appears to be an unusual dip in Winter 1994 Paralympics which may need further investigation.