Debugging
Debugging is the process of identifying and removing errors from computer hardware or software.
This guide provides a summary of some approaches you could use.
Using print statements
"The most effective debugging tool is still careful thought, coupled with judiciously placed print statements." Brian Kernighan
Famous programmers who reportedly prefer print statements include Guido van Rossum (Python), Robert C. Martin (author and Agile Manifesto signatory) and Brian W. Kernighan and Rob Pike (UNIX).
See the following example from https://www.alpharithms.com/python-breakpoint-built-in-function-410212/
def find_min(nums: [int]) -> int:
    """Finds the smallest integer value in a list"""
    smallest = 0
    for num in nums:
        print('num:', num, 'smallest:', smallest)  # Print added for debugging
        if num < smallest:
            print('num smaller; re-assigning value:', num)  # Print added for debugging
            smallest = num
    return smallest


if __name__ == '__main__':
    min_value = find_min([9, 6, 3])
    print(min_value)  # Returns 0 when 3 was expected
__repr__ returns a string representation of the object. For many types, this function makes an attempt to return a
string that would yield an object with the same value.
Calling __repr__ when using print() can provide clearer detail, so long as the __repr__ method has been defined
for a class.
Run the following to see the difference:
from decimal import Decimal

x = Decimal('3.4')
print(x)  # Without repr
print(repr(x))  # With repr
It should print:
3.4
Decimal('3.4')
When writing your own classes remember to include a __repr__ method. Run the following code to see the difference:
class PersonA:
    def __init__(self, name, age):
        self.name = name
        self.age = age

    def __repr__(self):
        return f'{self.__class__.__name__}('f'{self.name!r}, {str(self.age)})'


class PersonB:
    def __init__(self, name, age):
        self.name = name
        self.age = age


if __name__ == '__main__':
    pa = PersonA('Olive', 6)
    pb = PersonB('Arthur', 6)
    print(repr(pa))  # __repr__ defined
    print(repr(pb))  # __repr__ not defined
This prints:
PersonA('Olive', 6)
<__main__.PersonB object at 0x7fccffd88748>
Breakpoints
Breakpoints are a location or condition under which we want the execution of code to be suspended. You can then inspect:
- Values of variables
- Call stack
- Threads
Pdb and breakpoint()
Python 3 is packaged with the Pdb debugger.
"It supports setting (conditional) breakpoints and single stepping at the source line level, inspection of stack frames, source code listing, and evaluation of arbitrary Python code in the context of any stack frame. It also supports post-mortem debugging and can be called under program control."
Pdb commands can be added to Python code and the results output to command line/terminal.
The typical usage to break into the debugger is to insert the following line into code to start the debugger:
import pdb;

pdb.set_trace()
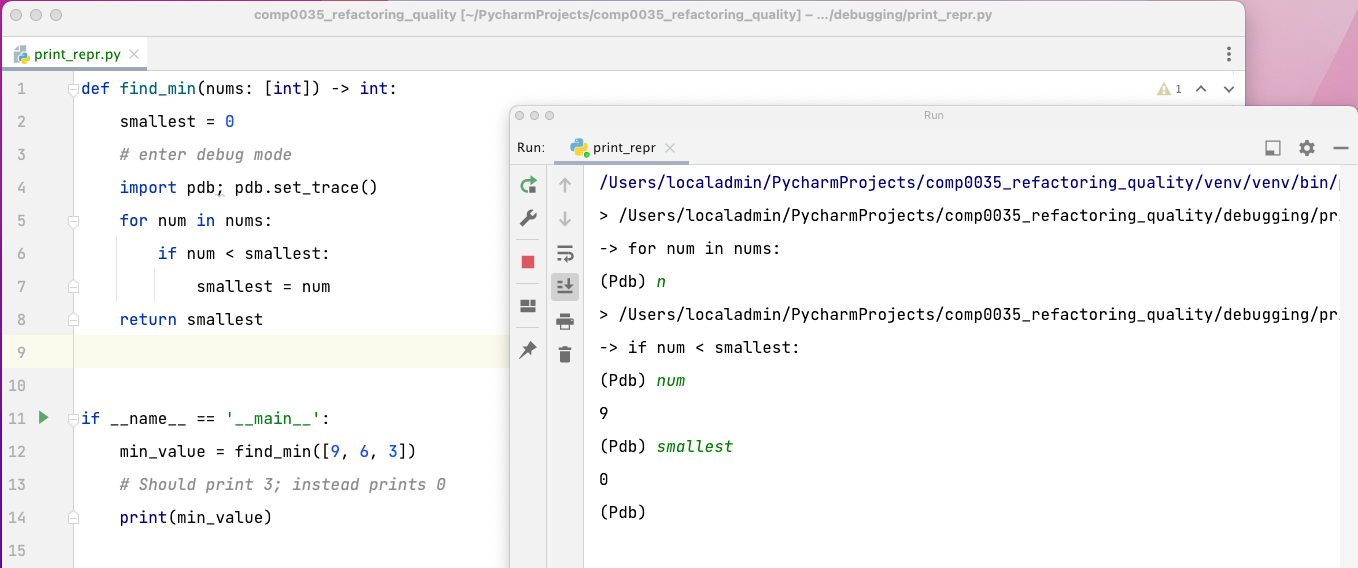
For example:
def find_min(nums: [int]) -> int:
    smallest = 0
    import pdb;
    pdb.set_trace()  # Enter the Python debugger
    for num in nums:
        if num < smallest:
            smallest = num
    return smallest


if __name__ == '__main__':
    min_value = find_min([9, 6, 3])
    # Should print 3; instead prints 0
    print(min_value)
This is more conveniently called by using the Python breakpoint() function which calls pdb.set_trace(), e.g.
def find_min(nums: [int]) -> int:
    smallest = 0
    breakpoint()  # Enter the Python debugger
    for num in nums:
        if num < smallest:
            smallest = num
    return smallest
When pdb is entered, you can enter commands to walk through the code e.g.
n(ext) - Continues execution of program until the next line is reached, or whether the current function returns.
c(cont(inue)) - Continues execution of our program until it reaches the next pdb.set_trace()
r(eturn) - Continues execution until the current function returns
s(tep) - Executes the current line and stops at the first possible occasion.
w(here) - Prints out a stack trace.
l(ist) - Lists the source code for the current file. With no arguments this equates to the 11 lines surrounding current line.
q(uit) - Quits the current debugging session.
For a full list of debugger commands have a look at the official documentation.
If you execute the example code then enter the following commands when Pdb starts:
- Enter
nextornto move to the next step - Enter
numto see the current value of num, this should return 9 - Enter
smallestto see the current value of smallest, this should return 0 - Repeat the above to see the values of num and smallest as it iterates through the list
Interactive debugging in an IDE
Advantages of interactive debuggers:
- Inspect all the variables at the debug point
- Look at the call stack
- Modify variables on the fly
- Visualise data structures
- Support third-party debugging libraries
To learn how to use these you will need to explore tutorials relevant to the IDE:
Using the debugger with pytest
pdb can
be combined with pytest to
aid debugging during testing.
Configure verbose test reports e.g. pytest --v to generate more detailed test results.
Use pytest with pdb with breakpoints: e.g.
# use the the Python debugger and report on every failure
pytest --pdb

# drop into pdb on the first failure, then end test session
pytest -x --pdb

# drop into pdb before the tests and you can then step through each breakpoint to the end of the test
pytest test_login.py --trace
This guide suggests starting with print(), and if that doesn't help identify the problem move on to adding breakpoints and use pdb.