Database design
What this guide covers
This guide summarises the information covered in the teaching materials and provides steps that can be followed to design the database for your coursework.
The teaching materials cover the three stages of SQL database design:
- Conceptual design stage
- Logical design stage
- Physical design stage
Brief recap of relational database concepts from the lecture
Relational database
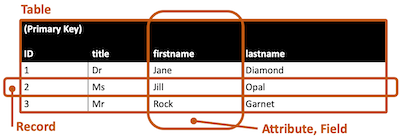
A relational database is a method of structuring data as tables associated to each other by shared attributes:
- a table row corresponds to a unit of data called a record
- a column corresponds to an attribute (or field) of that record
Relational databases typically use Structured Query Language SQL) to define, manage, and search data.
Relational database design
Database design is the organization of data according to a database model. The designer determines what data must be stored and how the data elements interrelate.
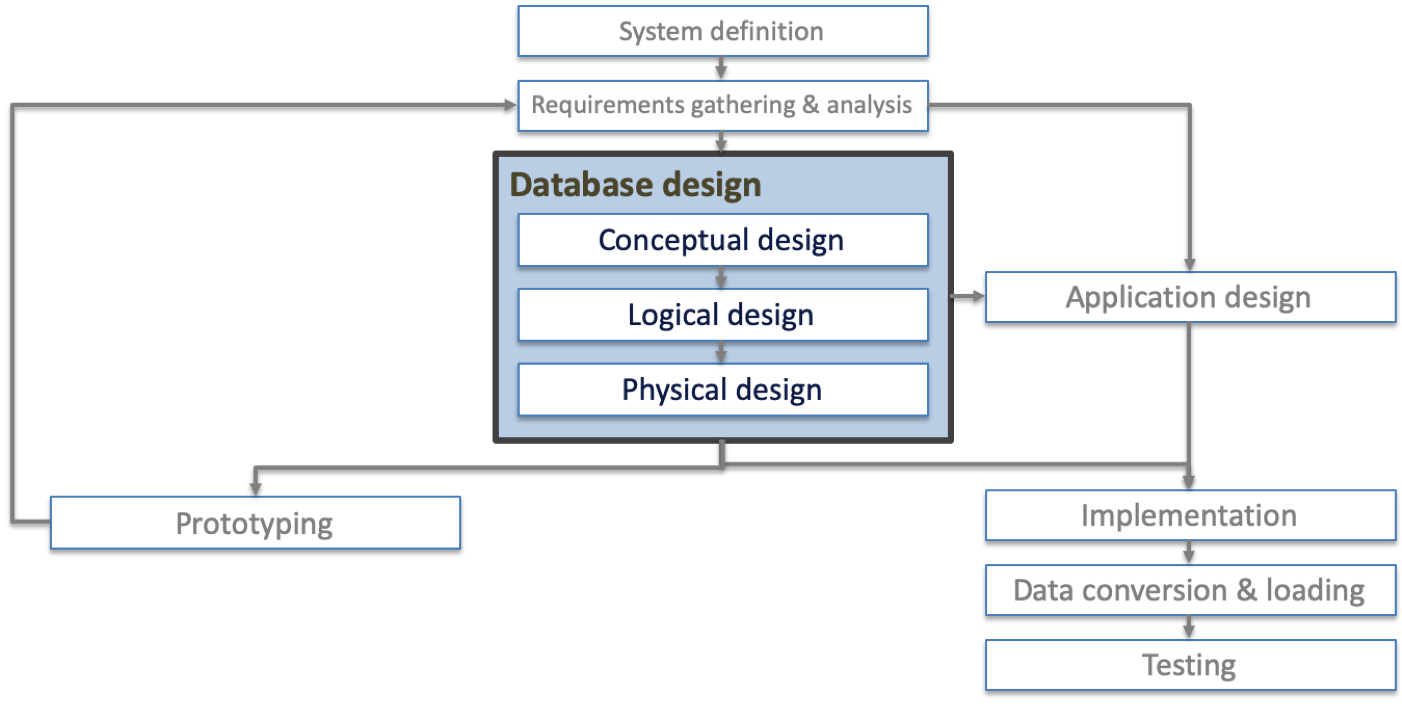
Connolly & Begg suggest three stages of database design. The are summarised as:
- Conceptual database design: the conceptual representation of the database, including identifying the important entities, relationships and attributes
- Logical database design: use normalization techniques to translate the conceptual representation to the logical structure of the database
- Physical database design: decide how the logical structure is to be physically implemented in the target database management system
Normalisation
Normalisation is the process of structuring data into tables in a way that avoids update anomalies and reduces data redundancy.
The process divides larger tables into smaller tables and links them using relationships between key attributes.
- Primary key (PK): a column (or combination of columns) guaranteed to be unique for each record and cannot be NULL
- Foreign key (FK): a column in table A storing a primary key value from table B
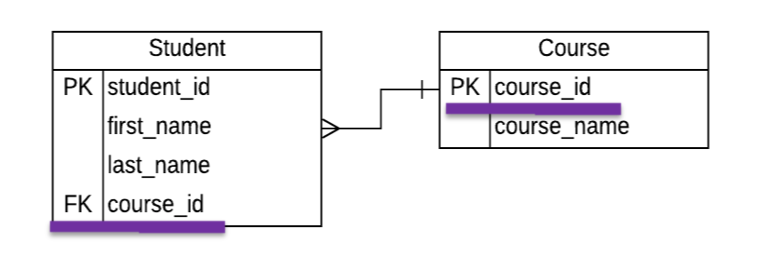
A course is taken by many students, each student is enrolled on only one course
There are different levels of normalization. It is not always desired, or necessary, to achieve 6th normal form, for the purposes of this course (and many applications) 3rd normal form is typically sufficient
This course focuses on the general principles of normalization rather than the formal relational theory (refer to either of the database textbooks in the reading list if you wish to understand this topic in more detail)
You are typically looking to revise your database design such that:
- Each column/row intersection has only one entry
- Each row and column in a table is unique
- Each table has a primary key (a unique identifier)
- Tables with relationships are linked by primary/foreign key relationships
- If you delete a record you don’t also lose a value that may still be needed
- Where there is a many-to-many relationship you will need to add a new table between the two tables so forming two one-to-many relationships.
Entity Relationship Diagram (ERD)
An ERD is a structural diagram used in database design. It contains different symbols and connectors that represent:
- The major entities within the system scope
- The attributes of those entities (including name and data type)
- The relationships among these entities
As the ERD is refined, further detail can be added to it. The ERD diagram can therefore be used at different stages of the database design process.
The diagram illustrates entities and attributes at different levels of detail:
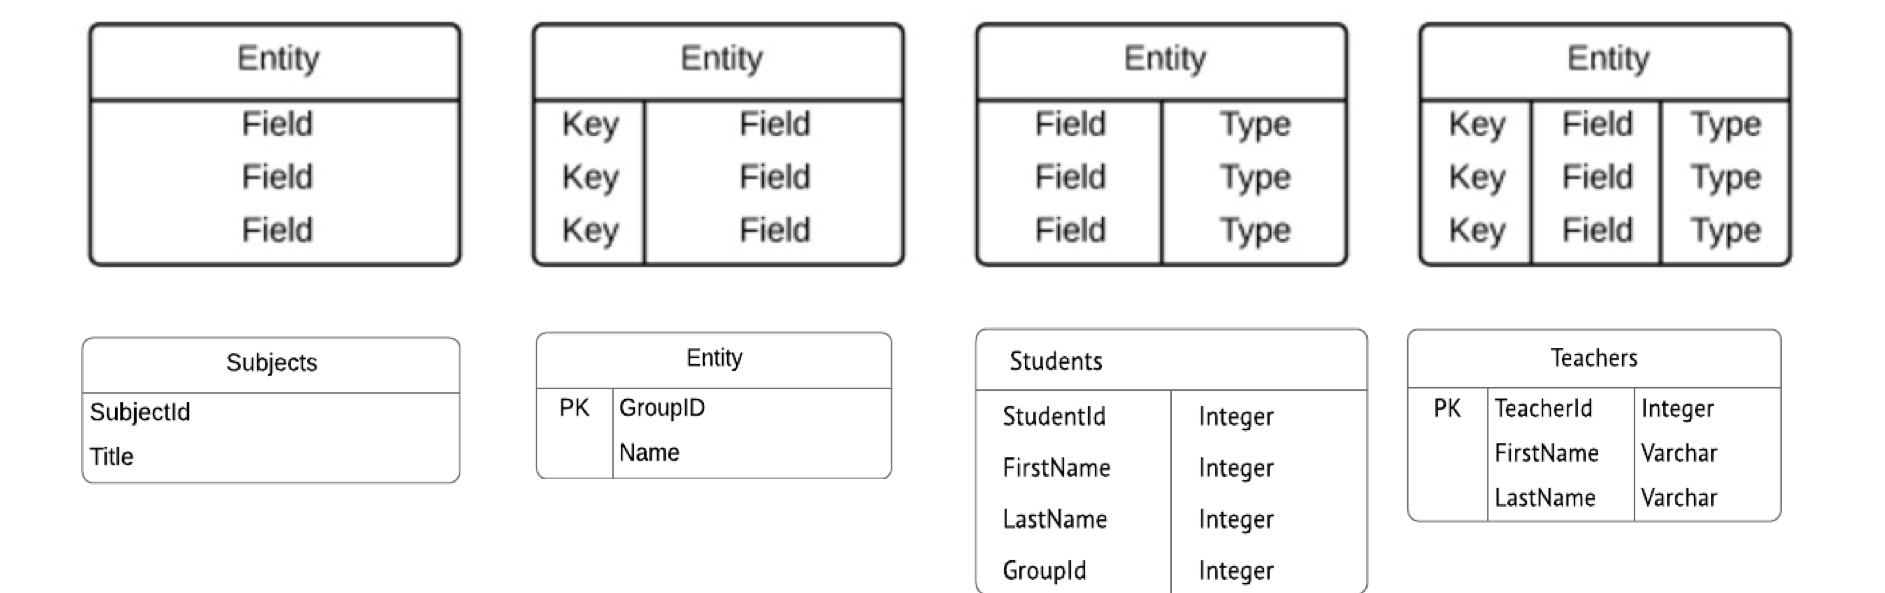
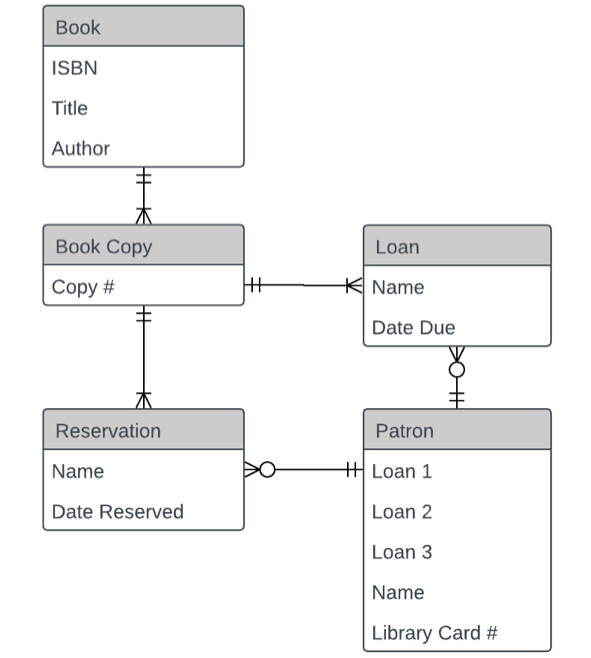
The relationships between entities can be represented with Crow’s Foot notation, or other notations such as Chen’s notation.
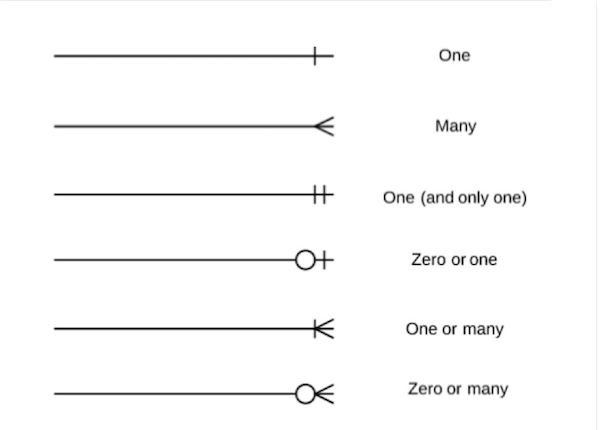
Entity relationships may be one-to-one, one-to-many, many-to-many, these are shown as:
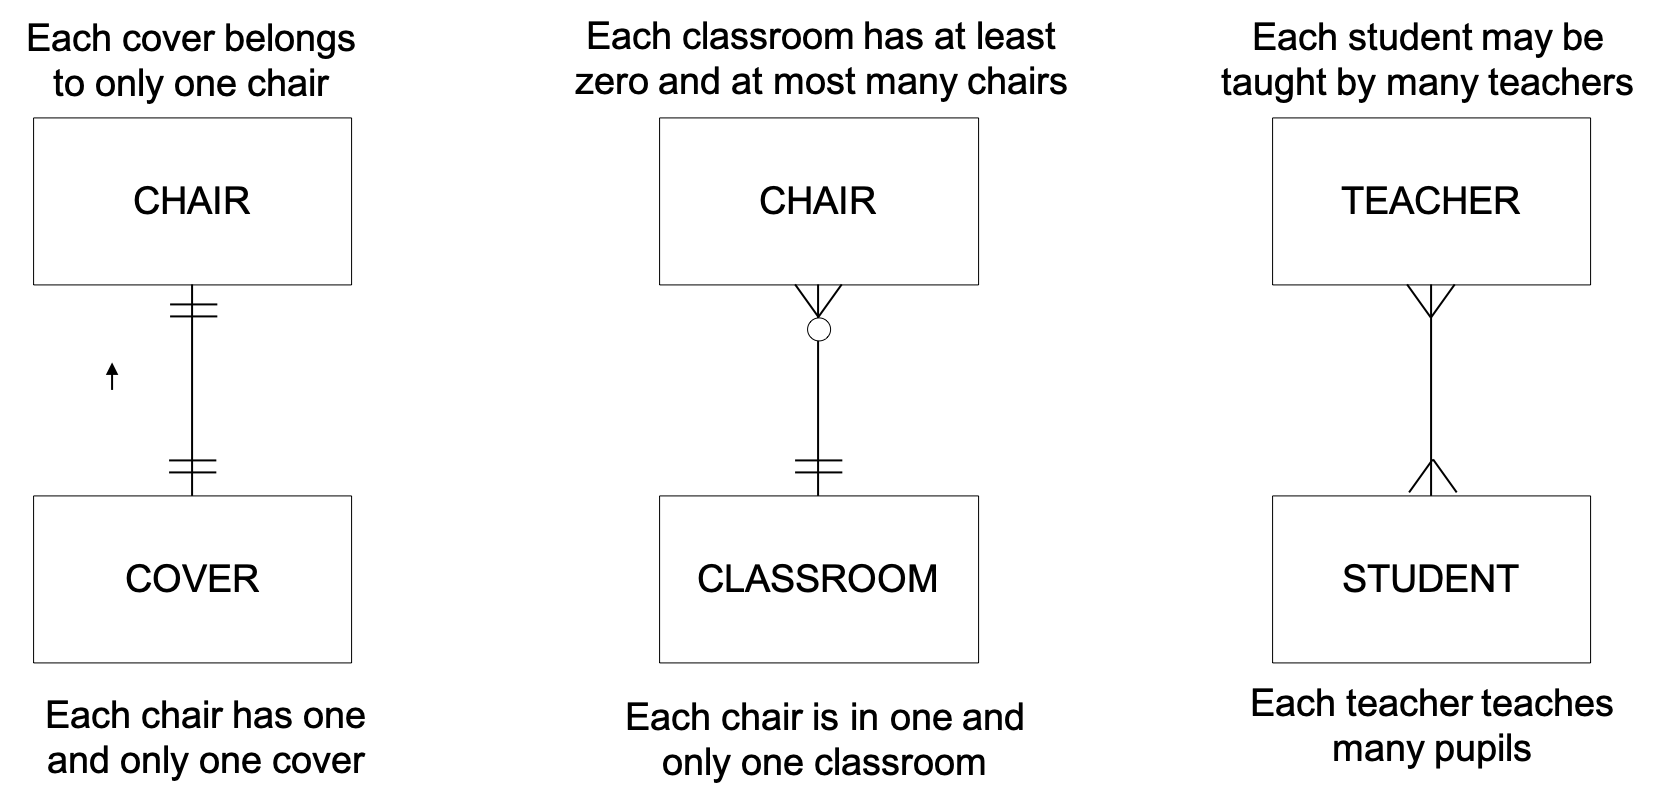
Relational databases do not typically implement many-to-many relationships. During the process of normalisation:
- one-to-one: Tables are associated through the primary key in each table
- one-to-many: The primary key attribute in the one must be listed as an additional attribute (foreign key) in the many. The tables are associated by the similar attributes.
- many-to-many: A new table is always created and the primary key attributes of the original tables are made attributes of the new table. These are often combined to form a composite primary key – or a new surrogate primary key is created.
Design the database
Design for SQLite
For the coursework it is expected that students will use SQLite. This is preferred as it creates a standalone file that can be easily included in your GitHub repository. Remember that SQLite datatypes are different to the wider range of SQL data types!
If you believe your design requires a database that requires a database server (e.g., MySQL, PostgresSQL) then please be aware that in COMP0034 you will need to provide the SQL to generate the database, and you will need to ensure that the server software you use is free (i.e., doesn't require a paid license) as the course tutor will need to install it in order to mark your coursework.
Conceptual design stage
Identify the entities and attributes.
Start with your dataset; and then consider your user stories, requirements and wireframes.
You could use the data driven design approach covered in the lecture materials. This approach suggests that you look for the nouns (entities) and adjectives (attributes).
- Identify the entities that are involved. Draw them as rectangles.
- Determine how the entities are related to each other. Draw lines between them to signify the relationships.
- Add attributes to the entities. Add the main attributes of entities e.g. add a list of attributes in the entity rectangles.
- Add the cardinality i.e., show whether the relationship is 1-1, 1-many or many-to-many.
Note: You do not have to use the crows foot notation style shown in the teaching materials. Any formal ERD notation is acceptable.
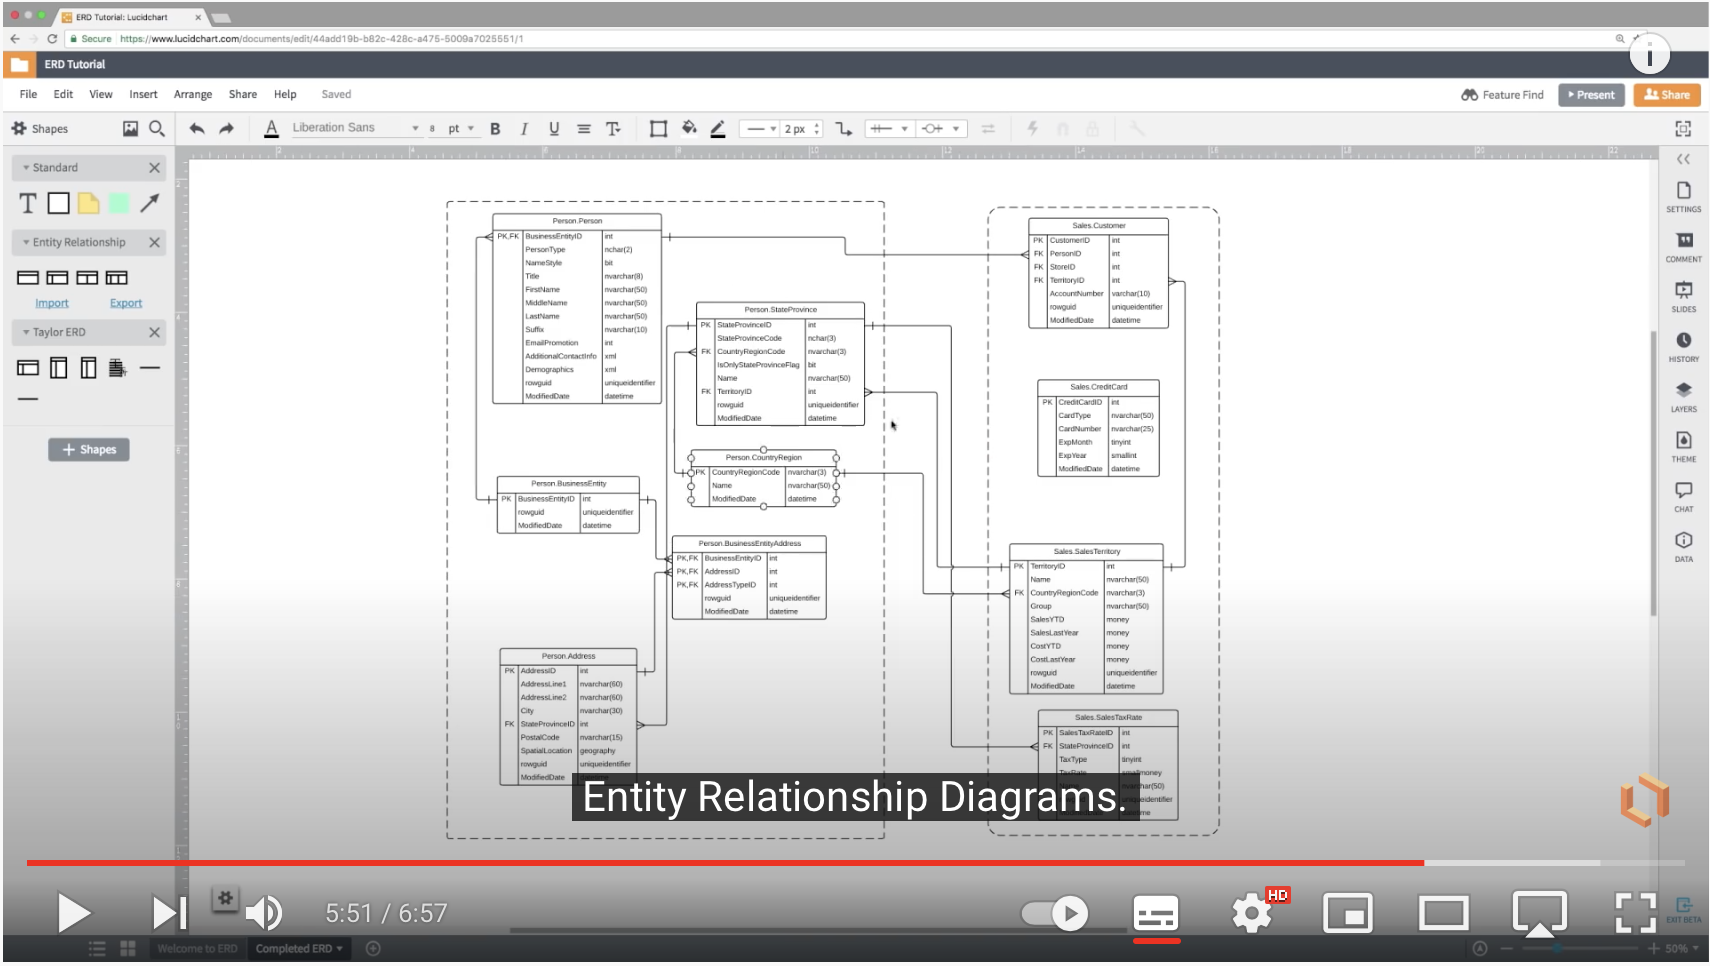
The following YouTube video from LucidChart may be useful in helping you to create an ERD:
Logical design stage
Each of the entities and their associated attributes defined at the conceptual stage can be considered as a potential table for your database. However, you are likely to need to modify the tables so that they will work in a relational database.
1. Normalise the database
To do this you start a process called normalization. You are not expected to understand all levels of normalisation. You are aiming for 3rd normal form for your coursework.
In simple terms look to:
- Remove redundant (repeated) data (except for primary/foreign keys) by splitting tables into new tables
- Have a primary key attribute for each table that is an integer field (or a combination of fields to create a composite primary key)
- Where there is a one-to-many relationship between tables, the primary key in one table becomes a foreign key attribute in the second table.
- Where there is a many-to-many relationship you need to create a third table that uses the primary key from each of the other two tables as foreign keys in that new table.
For a table to be in the first normal form (1NF), it must meet the following criteria:
- Atomicity: Each column should contain only atomic (indivisible) values.
- Uniqueness: Each column should contain unique values.
- Primary Key: Each table should have a primary key that uniquely identifies each row.
- No Repeating Groups: There should be no repeating groups or arrays in a table (i.e. no duplicated rows or columns)
For a table to be in second normal form (2NF):
- First Normal Form: The table must already be in 1NF.
- Full Functional Dependency: All non-key attributes must be fully functionally dependent on the primary key. This means that each non-key attribute should depend on the whole primary key, not just part of it.
For a table to be in third normal form (3NF):
- Second Normal Form: The table must already be in 2NF.
- No Transitive Dependency: There should be no transitive dependencies. This means that non-key attributes should not depend on other non-key attributes.
2. Add data types
You may have done this at the conceptual design stage. If not then add the data type to each attribute. This is the database data type which is not the same as Python data types.
SQLite data types are flexible, that is SQLite will attempt to match the provided data type in the data to the column definition.
SQLite will support most of the variants of SQL data types but will store the data type as one of the following:
- NULL. The value is a NULL value.
- INTEGER. The value is a signed integer, stored in 0, 1, 2, 3, 4, 6, or 8 bytes depending on the magnitude of the value.
- REAL. The value is a floating point value, stored as an 8-byte IEEE floating point number.
- TEXT. The value is a text string, stored using the database encoding (UTF-8, UTF-16BE or UTF-16LE).
- BLOB. The value is a blob of data, stored exactly as it was input.
3. Identify any constraints
Identify any constraints on each attribute.
Following are commonly used constraints available in SQLite:
- NOT NULL − Ensures that a column cannot have NULL value.
- DEFAULT − Provides a default value for a column when none is specified.
- UNIQUE − Ensures that all values in a column are different.
- PRIMARY KEY − A combination of a NOT NULL and UNIQUE. Uniquely identifies each row in a table.
- CHECK (expression) − Ensures that all values in a column satisfies certain conditions.
For foreign keys you can also consider ON DELETE and ON UPDATE actions; these relate to what to do when the related record in the parent table is deleted or changed. These are documented in the SQLite reference on foreign keys in section 4.3.
Drawing the schema
The result of the logical design is called a schema. You may draw it as a more detailed ERD i.e. the entities now represent the normalized tables.
NB: If code is shown below this is an issue with the web page not rendering the diagram, you do not write code for the diagram!
erDiagram
    STUDENT ||--o{ ENROLLMENT : "is enrolled in"
    COURSE ||--o{ ENROLLMENT : "has students enrolled"
    COURSE ||--o{ TEACHING_ALLOCATION : "is taught by"
    TEACHER ||--o{ TEACHING_ALLOCATION : "is teaching"
    STUDENT {
        int student_id PK
        text first_name "NOT NULL"
        text last_name "NOT NULL"
        text email "NOT NULL"
    }
    ENROLLMENT {
        int student_id FK,PK
        int course_id FK,PK
        int year "NOT NULL"
    }
    TEACHING_ALLOCATION {
        int teacher_id FK,PK
        int course_id FK,PK
        int year "NOT NULL"
    }
    COURSE {
        int course_id PK
        text course_name "NOT NULL"
        text is_active "NOT NULL, CHECK(boolean)"
    }
    TEACHER {
        int employee_id PK
        text first_name "NOT NULL"
        text last_name "NOT NULL"
        text email "NOT NULL, UNIQUE"
    }
Whichever diagram format you use the detail should demonstrate that the tables that are appropriately normalised. For example, a format that shows:
- Tables (entities)
- For each table (entity) show:
- column name (attribute name)
- data type
- any constraints
- primary/foreign keys
- Relationships between tables (e.g. one-to-many, one-to-one)
- Cardinality (e.g. zero, one, many or a fixed number)
Online ERD design tools
At the time of writing the following were free to use but may require you to create an account.
- Visual Paradigm online
- Diagrams.net
- LucidChart Free account is now limited to 3 diagrams; there is an ERD crow's foot template available.