Guide to using wireframes to design the user interface (UI)
What this guide covers
This guide provides an introduction to using wireframes as a technique for designing the user interface for your web apps.
What is a wireframe?
A wireframe is a low fidelity design of an application that allows you to focus on basic layout and interaction of an interface independent of styling. It is typically used for early prototyping in web applications, though it is not the only technique that can be used.
It provides an outline of the structure and layout and presents the main information and application flows.
The following examples show both hand drawn and digital wireframes:
| Hand-drawn | Digital |
|---|---|
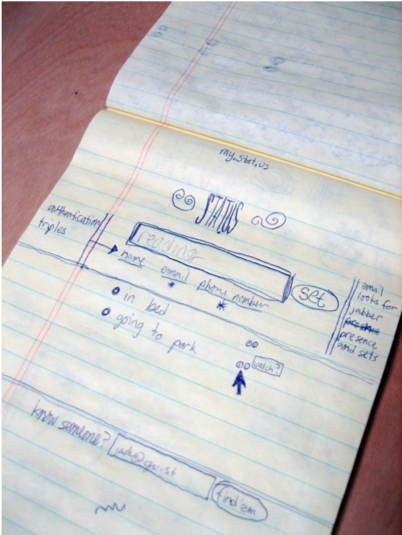 |
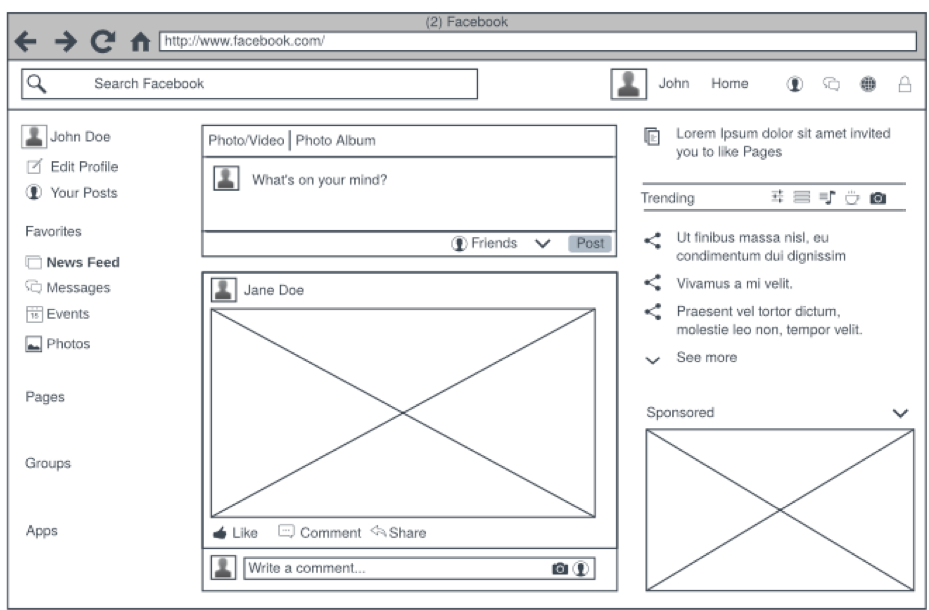 |
Why create a wireframe?
"A picture is worth a thousand words", wireframes clearly communicate design ideas to stakeholders and teammates to facilitate decision-making. Wireframes can provide a reference point for the functionality that will need to be built.
They are quick to create and change so you can explore ideas with minimal effort. Keeping it lo-fi (sketch) helps avoid a focus on visual design.
They can also be a useful technique for eliciting further requirements, or refining existing requirements.
When to create wireframes
Some use wireframes to help capture and/or refine requirements; others develop them after the requirements are documented. Whenever you start there is likely to be some iteration.
Which screen size(s) and orientation are you designing for?
Responsive design describes an approach to web design that makes web pages render well on a variety of devices and window or screen sizes. In COMP0034, we will look at the concept of responsive design and how we can achieve this using styling with CSS.
Consider your target user group and design for the screen size they are most likely to use. For example, designing for a user audience primarily using a phone would imply a different layout to a target audience primarily using a laptop or desktop PC (not least as one is portrait and the others landscape in orientation).
Statcounter.com provides statistics for the most commonly used screen sizes.
How to create wireframes
There is no single format or approach to creating wireframes.
This is a generalised approach that is influenced by Alex Coleman's article How to create web application wireframes .
-
Start with your requirements (e.g. user stories), and/or if you have them use cases. Try to write down the key goals the user has when using your web app, e.g.
- Create and manage user account
- Create an account
- Update account e.g. change password
- Login
- Logout
- Analyse data using chart X
- View chart X
- Tailor chart X
- Manage data (e.g. in the tutorial example project this might be managing the data associated with a paralympic
event)
- Search for an existing data entry and view it
- Create a new data entry
- Update/edit an existing data entry
- Create and manage user account
-
For each of the above sketch out a potential wireframe of the page (or area of the page if a single page app design is used for a dashboard style app).
-
Optionally, consider how the user may navigate from one page/feature to the next. A flow chart may be useful here.
Wireframes for the coursework
- Consider using the approach given above.
- Save the wireframes in a suitable format (.png, .pdf, .jpeg) so you can then embed the images within your coursework2 document or markdown file.
- Styling is not assessed in the coursework so focus on the data presented and the overall layout and flow (i.e., functionality rather than visual design).
- Hand-drawn and scanned/photographed wireframes are appropriate. You do not get higher marks for using a digital tool to create them. If you do use a tool, remember to export/save the files to a suitable format as you cannot link to external sites for the coursework submission.
- Do not write a textual commentary with the wireframes. Someone should be able to look at your wireframes and gain an understanding of the structure and flow of your app without an extensive written commentary. If you really need to, you can add minimal annotations to a wireframe.
- Check that your wireframes are consistent with the requirements, the application design and database design. For example, if you are capturing new data to store in the database, these data attributes might be expected to be present as elements in a wireframe.
Further guidance, tools and templates
Further guidance, templates and free online tools (e.g. Figma with student sign up) are available in the reading list on Moodle.
Lots of companies provide limited trial versions of online wireframe tools such as Balsamiq, Adobe. If you use these, ensure you save your designs in an image format (e.g., png, jpd, pdf) before the trial expires!
If designing a dashboard, you may wish to look at chart types in the following resources: